On-chain data shows the Bitcoin Active Addresses have continued to see a steep decline recently, a sign that could be bearish for BTC.
Bitcoin Active Addresses Have Recently Seen Their Biggest Drop Since 2021
As pointed out by an analyst in a CryptoQuant Quicktake post, the BTC Active Addresses have been seeing a decline since March of this year. An address is said to be “active” when it participates in some kind of transaction activity on the network, whether as a sender or receiver.
The Active Addresses indicator keeps track of the unique total number of such addresses that are making transfers on the Bitcoin blockchain every day. The unique active addresses may be considered the same as the unique users visiting the network, so the metric essentially tells us about BTC’s daily traffic.
Now, here is a chart that shows the trend in the 100-day Simple Moving Average (SMA) of the Bitcoin Active Addresses over the last few years:

As displayed in the above graph, the 100-day SMA of the Bitcoin Active Addresses had been rising during 2023 and the early parts of this year, but since March, the metric has seen a sharp turnaround, with its value now rapidly going down instead. The reversal occurred around the time of BTC’s new all-time high (ATH), so it’s likely that the indicator’s decreasing is happening due to the consolidation that the coin has since been stuck in.
Investors find sharp price action like rallies to be exciting, while sideways movement to be boring, so the Active Addresses registering a downturn in a period like now isn’t too odd. What may be worth noting, though, is the scale of the drop that the 100-day SMA of the metric has observed. Its value is already below the lowest point observed in the 2022 bear market and could soon fall below the 2021 low as well.
Bitcoin generally requires an active userbase to keep any rally going, so the indicator’s value witnessing a collapse recently could be a bearish sign. “You should not be surprised if BTC’s price starts catching up with address activity trend very soon,” notes the quant.
While the Active Addresses trend has been looking negative, CryptoQuant CEO Ki Young Ju has said in an X post that Bitcoin is still in the middle of the bull cycle.
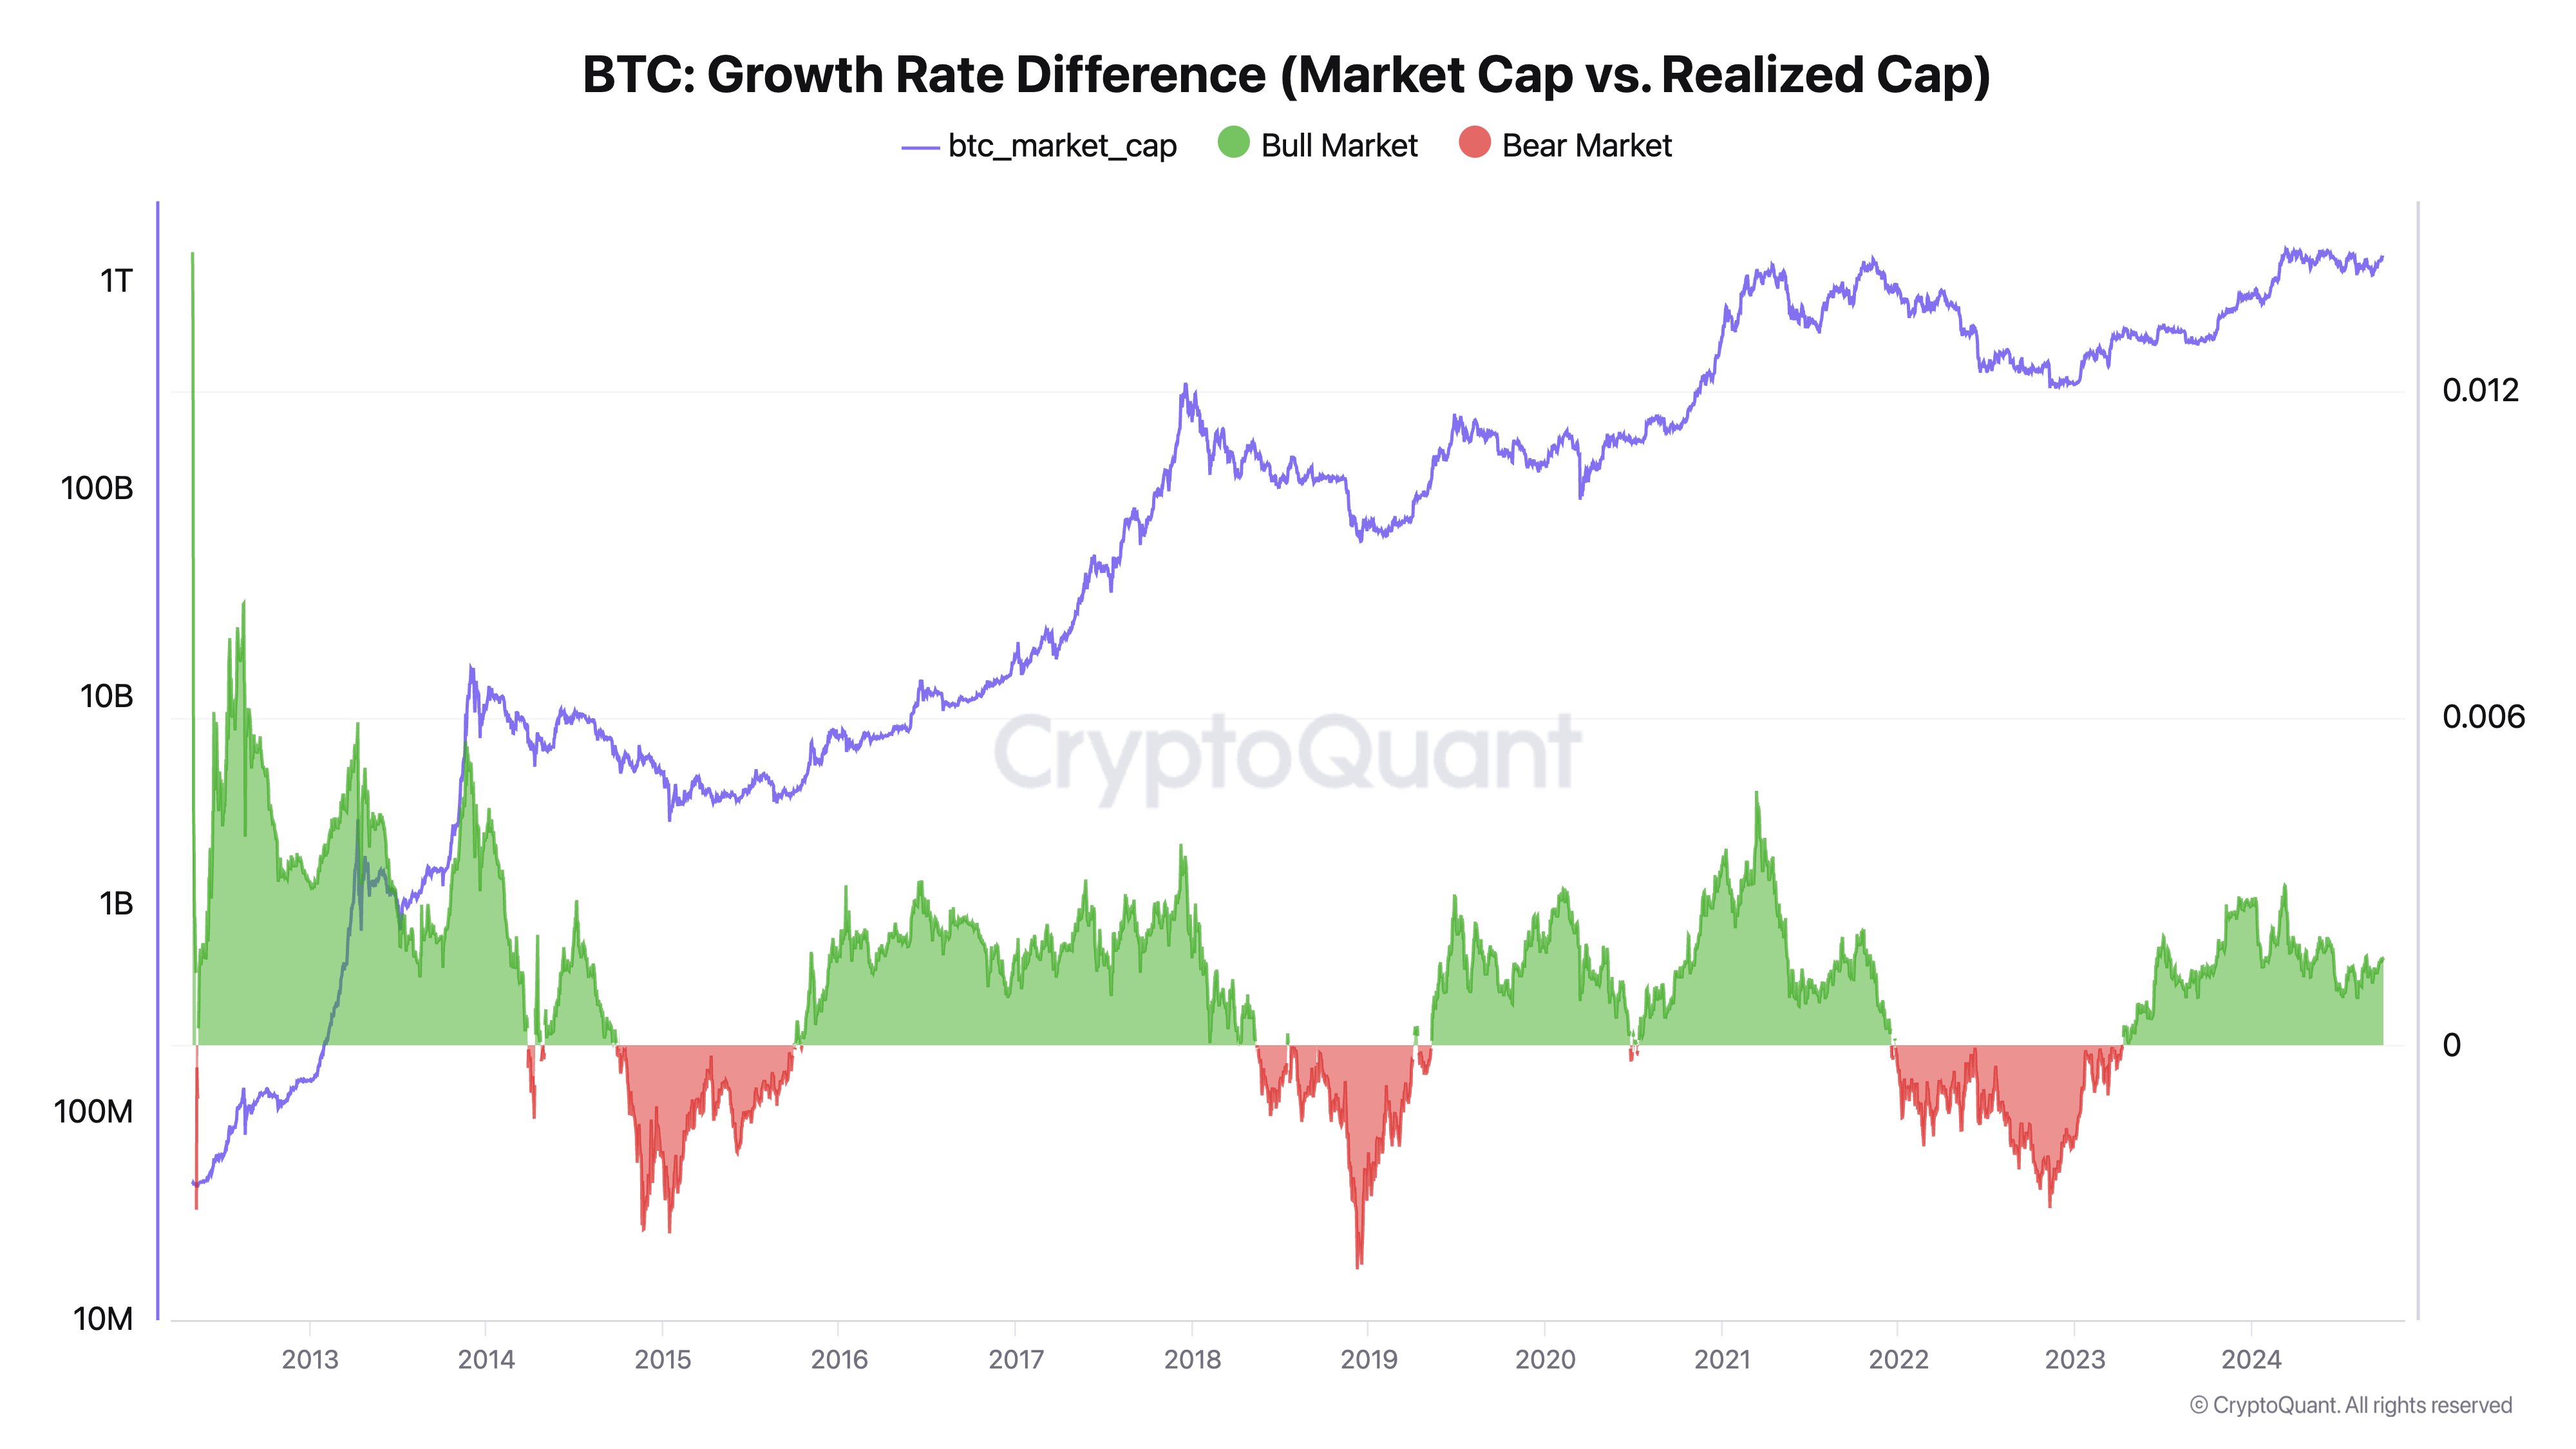
The above chart shared by Young Ju shows the trend in the Bitcoin Growth Rate Difference, which is an indicator that compares the growths of the BTC market cap and realized cap.
The latter of these, the realized cap, is an on-chain capitalization model that basically tells us about the amount of capital that the investors as a whole have put into the cryptocurrency.
At present, the indicator is green, meaning the market cap is growing faster than the realized cap. “When market cap grows faster than realized cap, it may signal a bull market; the reverse could indicate a bear market,” explains the CryptoQuant CEO.
BTC Price
Bitcoin has seen a continuation of its latest plunge during the past day as its price has now slipped to the $62,700 level.

You can get bonuses upto $100 FREE BONUS when you:
💰 Install these recommended apps:
💲 SocialGood - 100% Crypto Back on Everyday Shopping
💲 xPortal - The DeFi For The Next Billion
💲 CryptoTab Browser - Lightweight, fast, and ready to mine!
💰 Register on these recommended exchanges:
🟡 Binance🟡 Bitfinex🟡 Bitmart🟡 Bittrex🟡 Bitget
🟡 CoinEx🟡 Crypto.com🟡 Gate.io🟡 Huobi🟡 Kucoin.


Comments