Bitcoin price recovered losses and surpassed the $56,550 resistance zone against the US Dollar. BTC is likely to rally if there is a close above $58,000 and the 100 hourly SMA.
- Bitcoin remained strong above $54,000 and it climbed above $56,550
- The price is now facing resistance the $57,500 level and the 100 hourly simple moving average.
- There was a break above a key bearish trend line with resistance near $56,800 on the hourly chart of the BTC/USD pair (data feed from Kraken).
- The pair could start a strong increase if there is a close above $58,000 and the 100 hourly SMA.
Bitcoin Price Recovers Losses
Bitcoin declined sharply after it failed to test the $60,000 resistance. BTC broke the $57,500 and $55,500 support levels. However, it found support near $53,500 and it recently started a fresh increase.
There was a decent recovery wave above the $55,000 and $56,000 levels. The price cleared the 50% Fib retracement level of the key decline from the $59,500 swing high to $53,460 swing low. There was also a break above a key bearish trend line with resistance near $56,800 on the hourly chart of the BTC/USD pair.
The pair is now facing resistance the $57,500 level and the 100 hourly simple moving average. It is also stuck near the 61.8% Fib retracement level of the key decline from the $59,500 swing high to $53,460 swing low.
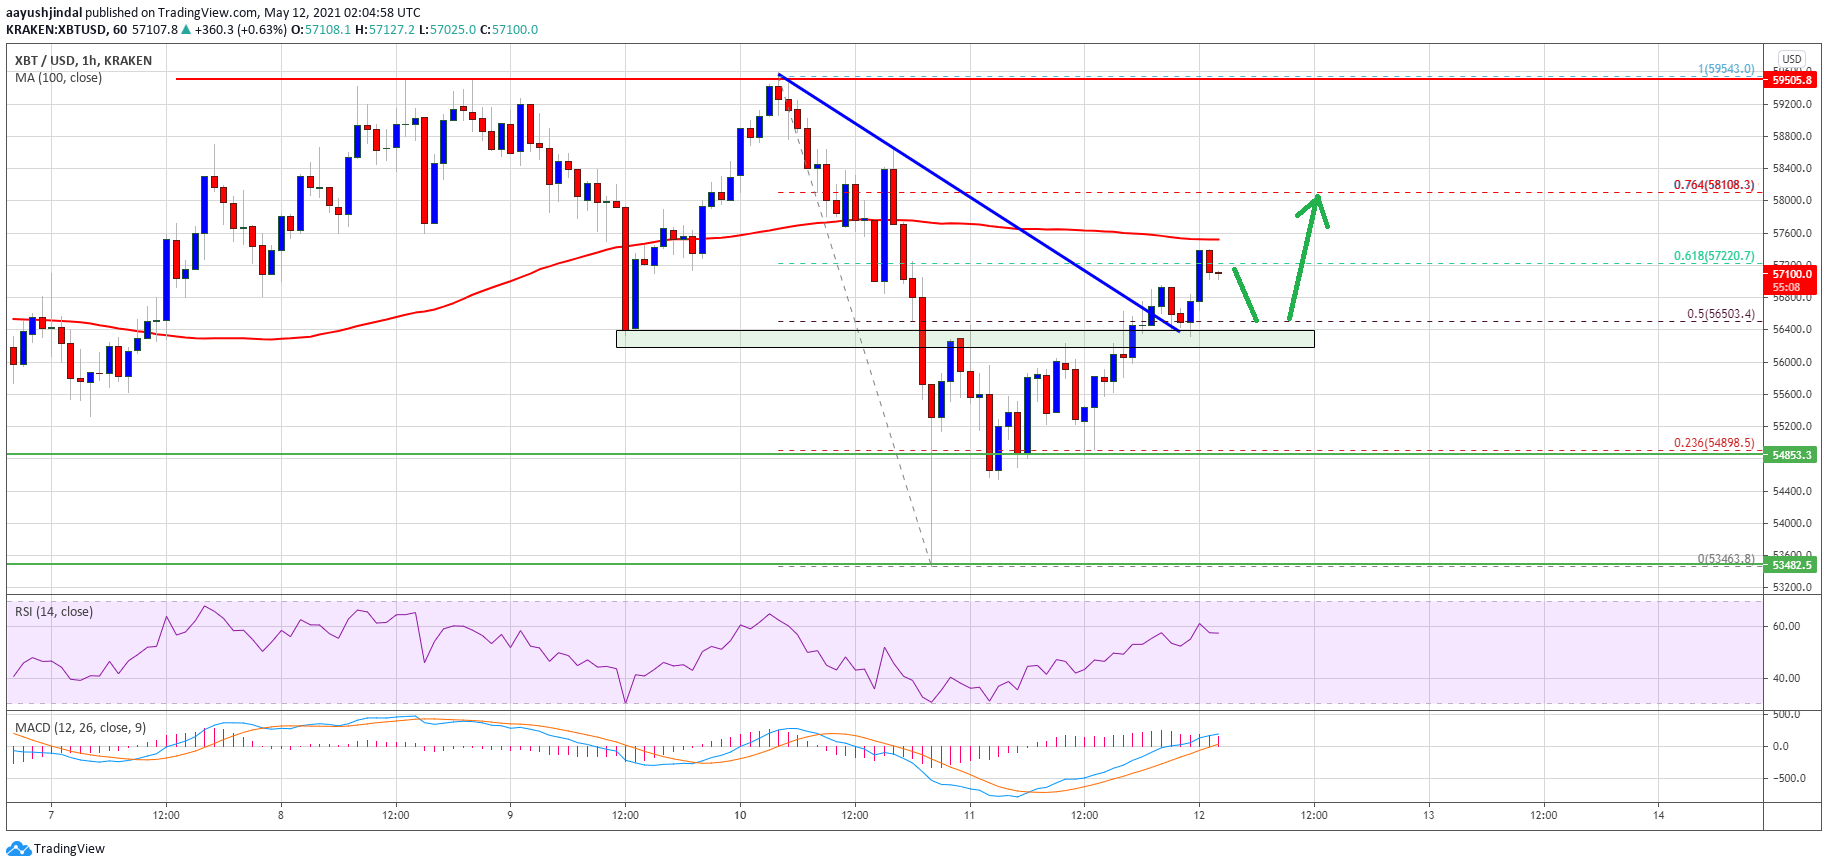
Source: BTCUSD on TradingView.com
To start a strong increase, bitcoin must clear the $57,500 barrier and the 100 hourly SMA. The next immediate resistance is near $58,000, above which the price could grind higher towards the $59,500 level. The main resistance is still near the $60,000 zone.
Fresh Drop in BTC?
If bitcoin fails to clear the $57,500 resistance or $58,000, it could start a fresh decline. An initial support on the downside is near the $56,500 level.
A downside break below the $56,500 support zone could lead the price towards the $54,850 pivot level. Any more losses might call for a fresh test of the $53,500 support zone in the near term.
Technical indicators:
Hourly MACD &- The MACD is slowly gaining pace in the bullish zone.
Hourly RSI (Relative Strength Index) &- The RSI for BTC/USD is now above the 50 level.
Major Support Levels &- $56,500, followed by $54,850.
Major Resistance Levels &- $57,500, $58,000 and $59,500.

You can get bonuses upto $100 FREE BONUS when you:
💰 Install these recommended apps:
💲 SocialGood - 100% Crypto Back on Everyday Shopping
💲 xPortal - The DeFi For The Next Billion
💲 CryptoTab Browser - Lightweight, fast, and ready to mine!
💰 Register on these recommended exchanges:
🟡 Binance🟡 Bitfinex🟡 Bitmart🟡 Bittrex🟡 Bitget
🟡 CoinEx🟡 Crypto.com🟡 Gate.io🟡 Huobi🟡 Kucoin.


Comments