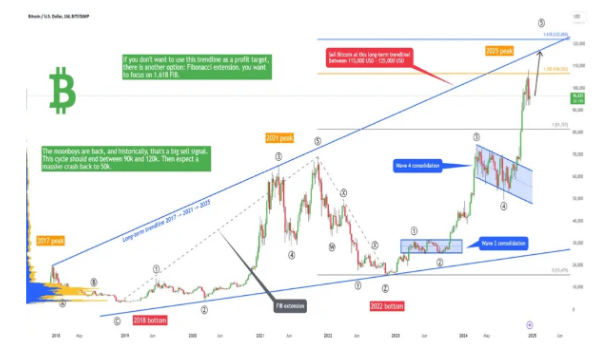
The ongoing Bitcoin downside correction is strikingly similar to its price action in June-December 2019.
Bitcoin (BTC) faces the prospects of reaching $47,500-$50,000 based on its current trend's eerie similarity with the one in June through December 2019.
2019 Bitcoin fractal
In detail, Bitcoin topped out around $14,000 on June 26, 2019, before turning lower for the remainder of the year on profit-taking sentiment, and as well as FUD sparked by the Bitcoin Cash hardfork, Facebook's stand-off with regulators over its crypto project Libra, and then U.S. President Donald Trump and Treasury Secretary Steven Mnuchin's threatening tone on Bitcoin.
The flagship cryptocurrency crashed to near $6,500 in December 2019. In doing so, it prompted its 50-day simple moving average (SMA) to flip below its 200-day SMA, a phenomenon that technical chartists call a "death cross" and see its formation as a sign of extended sell-offs ahead.
But, at the same time, Bitcoin bulls held the price above the 50-week SMA. The cryptocurrency's one-day chart showed bears' attempts to crash the price below its 50-week SMA. But bulls bought those dips every time.
Willful buy actions near the 50-week SMA later led to a strong upside rebound towards the 61.8% Fib level that constituted a dropdown Fibonacci retracement graph, drawn from around the $14,000-swing high to approximately the$6,500-swing low.

The 2019 fractal also illustrated at least two bullish divergence scenarios, wherein the Bitcoin price formed lower lows while its daily relative strength indicator, a price-momentum oscillator, made lower highs. It hinted weakness in the prevailing bearish momentum. And as it turned out, the price soared later.
2021
In 2021, Bitcoin reconstructed the 2019 scenario halfway. At first, the cryptocurrency's correction from its record high of nearly $65,000 landed BTC/USD right at the same 50-week SMA support around $30,000. At the same time, its move lower enabled a death cross setup.
Bitcoin's price action in the past week also hinted at a bullish divergence scenario, as shown in the chart below.

TradingShot, a market analytics platform, noted that a bullish divergence formation, coupled with a rebound from the 50-week SMA support, could again send Bitcoin prices to the 61.8% Fib level of the current top-to-bottom Fibonacci retracement graph.
"The support of the 1W MA50 is key as it is being achieved despite Bitcoin being on Lower Lows (LL) while the 1D RSI is on Higher Lows (HL)," he explained.
"This is a Bullish Divergence and was also seen during October and late November-early Dec 2019. This divergence was enough to start the rebound to the 0.618 Fibonacci retracement level."

In a chart provided by TradingShot, the 61.8% Fib level appeared near $47,500. Meanwhile, the other chart above showed the profit target near $50,000.
Fundamentals
The statements appeared as Bitcoin closed its second quarter at a 41% loss, logging its worst declines since the 43% sell-off in the fourth quarter of 2018. The cryptocurrency's recent drop took cues from a flurry of negative fundamentals, including China's crackdown on the crypto industry, global regulators increasing their scrutiny, and as well as Elon Musk's anti-Bitcoin tweets.
Meanwhile, demand for Bitcoin also declined after the Federal Reserve's hawkish tone. The U.S. central bank announced that it might hike its benchmark interest rates by the end of 2023 to curb inflationary pressures, coinciding with a BTC/USD rate plunge on June 16 and afterward.
Despite strong headwinds, Bitcoin managed to float above $30,000, a psychological support level and is currently back above $35,000. However, the equally strong resistance level at $40,000 is keeping the cryptocurrency's short-term bearish bias intact.
"One expects that the longer we go without a $40,000-handle, eventually support is going to crumble and give way to a sharp move towards $20,000," Fawad Razaqzada, an analyst at ThinkMarkets, told the Wall Street Journal, noting that it leaves Bitcoin at crossroads in the third quarter.
TradingShot added:
"Have all the negative fundamentals priced in already? We can't know for sure but if they have, the Bullish Divergence on the 1D RSI definitely shows something."
The views and opinions expressed here are solely those of the author and do not necessarily reflect the views of Cointelegraph.com. Every investment and trading move involves risk, you should conduct your own research when making a decision.

You can get bonuses upto $100 FREE BONUS when you:
💰 Install these recommended apps:
💲 SocialGood - 100% Crypto Back on Everyday Shopping
💲 xPortal - The DeFi For The Next Billion
💲 CryptoTab Browser - Lightweight, fast, and ready to mine!
💰 Register on these recommended exchanges:
🟡 Binance🟡 Bitfinex🟡 Bitmart🟡 Bittrex🟡 Bitget
🟡 CoinEx🟡 Crypto.com🟡 Gate.io🟡 Huobi🟡 Kucoin.


Comments