
A small number of old hands choose to cover all their bases as BTC/USD clinches a July close above $41,000.
Bitcoin (BTC) closed July above $41,000 in a “bullish engulfing” candle that dramatically upends its previous downtrend.
In a tweet on Aug. 1, investor and entrepreneur Alistair Milne joined many in celebrating a classic return to form for BTC price action.
Bitcoin refuses to flip bearish
After seeing three monthly red candles in a row, BTC/USD held onto late gains to post a monthly close that few had anticipated.
Despite the dip to $29,000, bears failed to stay in the driver’s seat as July drew to a close as resistance levels fell and sentiment improved.
“Bullish engulfing on the monthly chart for Bitcoin,” Milne summarized.
A bullish engulfing pattern is a chart pattern that forms when a small red candle is followed by a large green candle — i.e., July, the body of which completely covers or engulfs the body of the previous candle (June).

The move up — and its staying power — has been so surprising that even seasoned hodlers appear confused about what to do next.
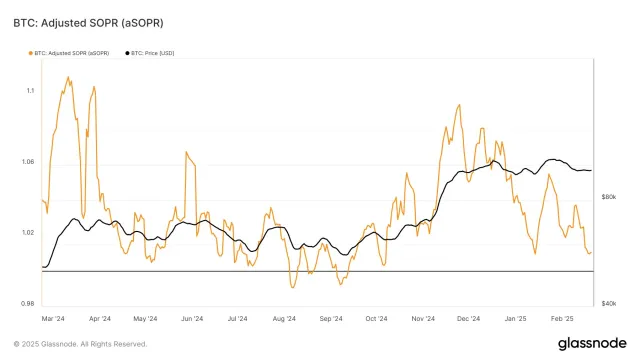
On-chain data shows that some long-term holders (LTH) are in fact selling as BTC/USD rises, something that analyst Lex Moskovski believes corresponds to the “disbelief” stage of a classic market cycle.
Moskovski highlighted the long-term holder spent output profit ratio indicator (LTH-SOPR), which this weekend hit its lowest levels in 2021.
SOPR looks at the value of coins moved in a particular time period to get an impression of profitability of coins being sold. A downtrend toward the neutral 1 value, Glassnode explained, suggests that profitability among the coins in question is low.
“Some long-term bitcoin holders are selling into this bounce with minimal profit as indicated by LTH-SOPR hitting this year’s low for two days straight,” Moskovski commented.
“This is one of the reasons we’re still at 41k. Disbelief.”

“Like clockwork”
Bulls, meanwhile, continue to look for triggers that could send BTC/USD past $42,000 resistance for good, this having seen two tests in the past 24 hours.
Related: Bitcoin 'supercycle' sets up Q4 BTC price top as illiquid supply hits all-time high
Beyond there, as Cointelegraph noted, little lies in the way until $45,000 and $47,000.
Equally enthusiastic for upside on Saturday was PlanB, the creator of the stock-to-flow price model family, who described Bitcoin’s July close as being a recovery “like clockwork.”
#bitcoin July closing price $41,490 ... it bounced from the lows, like clockwork pic.twitter.com/xZIlbaBBqI
— PlanB (@100trillionUSD) August 1, 2021
Stock-to-flow, while currently demanding a Bitcoin price of nearly $100,000, remains valid, with PlanB giving a minimum August close requirement of $47,000.

You can get bonuses upto $100 FREE BONUS when you:
💰 Install these recommended apps:
💲 SocialGood - 100% Crypto Back on Everyday Shopping
💲 xPortal - The DeFi For The Next Billion
💲 CryptoTab Browser - Lightweight, fast, and ready to mine!
💰 Register on these recommended exchanges:
🟡 Binance🟡 Bitfinex🟡 Bitmart🟡 Bittrex🟡 Bitget
🟡 CoinEx🟡 Crypto.com🟡 Gate.io🟡 Huobi🟡 Kucoin.


Comments