On-chain data shows user activity on Bitcoin went up during 2024, with the network processing an average of $8.7 billion in daily volume.
Bitcoin Witnessed A Massive Amount Of Economic Volume During 2024
In a new post on X, the on-chain analytics firm Glassnode has discussed about the trend in the Transfer Volume of Bitcoin. The “Transfer Volume” here refers to an indicator that measures the total amount of the asset that’s becoming involved in some kind of transaction activity on the blockchain.
The version of the metric shared by the analytics firm is the entity-adjusted one, meaning that it only includes the data of the transfers occurring between two separate entities. An ‘entity‘ is a cluster of addresses that Glassnode has determined to belong to the same investor.
Transfers between the wallets of the same investor can be relevant from the perspective of miners, but they don’t really represent true economic activity. Thus, the entity-adjusted Transfer Volume provides a more accurate measure of the total economic activity that’s taking place on the BTC network.
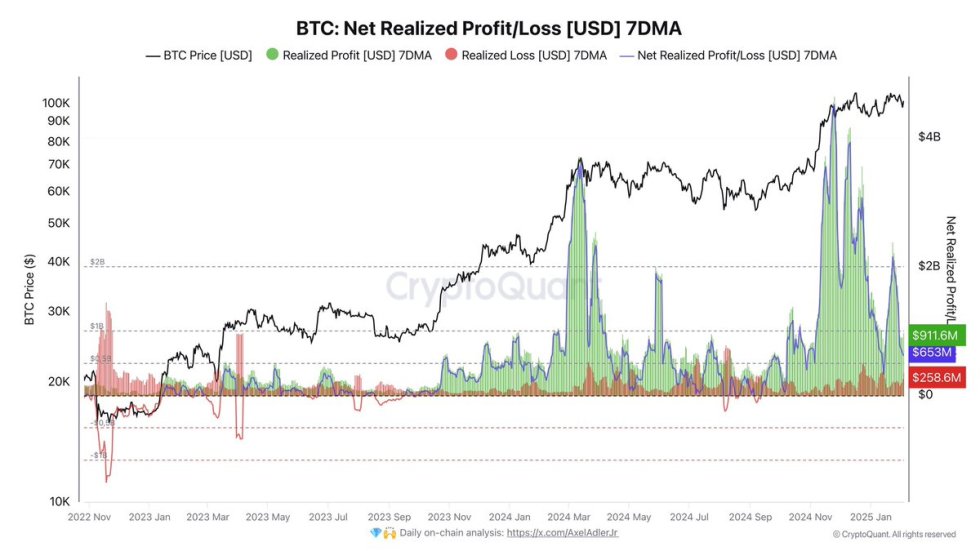
Now, here is the chart for the indicator shared by the analytics firm over the last few years:

As is visible in the above graph, the Bitcoin Transfer Volume shot up during the price exploration beyond $100,000 towards the end of 2024, but its value has since cooled off.
Nonetheless, the indicator observed a notable jump over the course of the year, suggesting activity on the whole has risen on the network. At present, the 365-day moving average (MA) of the metric sits at $8.7 billion, which is an appreciable value.
In total, 2024 saw the investors make economic transactions worth a whopping $3.2 trillion. The analytics firm has noted that this showcases the role that BTC has as a medium of large-scale exchanges.
In the same X thread, Glassnode has also shared how the Realized Cap of the cryptocurrency has grown during this cycle. The “Realized Cap” is a capitalization model for BTC that assumes the ‘real’ value of any token in circulation is equal to the spot price at which it was last transacted on the network.
In short, what this model tells us about is the amount of capital that the investors as a whole have used to purchase Bitcoin. Below is the chart for the indicator.

From the graph, it’s apparent that the Bitcoin Realized Cap has been growing over the last couple of days. “Since the Nov 2022 cycle low of $400B, Realized Cap has absorbed +$450B in capital, now totaling ~$850B,” notes the analytics firm.
BTC Price
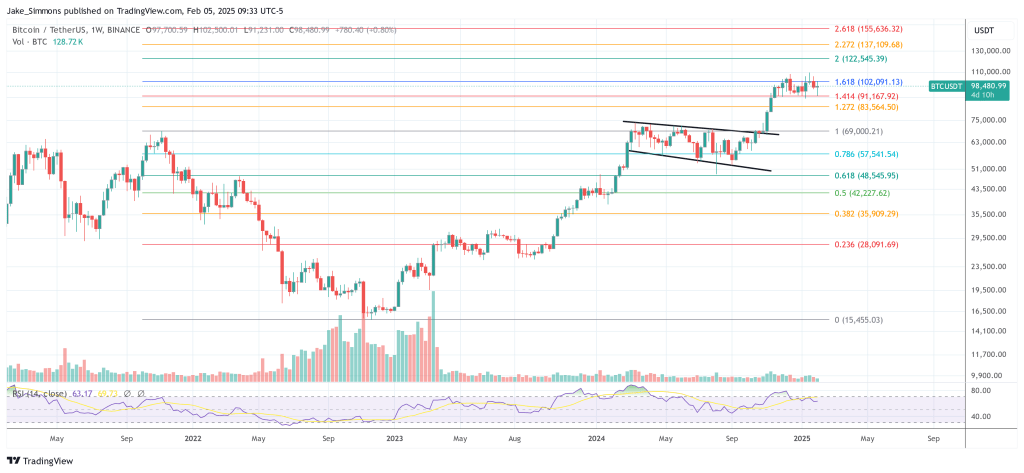
Bitcoin has been unable to sustain its latest recovery push as its price has now retraced back to $98,400.

You can get bonuses upto $100 FREE BONUS when you:
💰 Install these recommended apps:
💲 SocialGood - 100% Crypto Back on Everyday Shopping
💲 xPortal - The DeFi For The Next Billion
💲 CryptoTab Browser - Lightweight, fast, and ready to mine!
💰 Register on these recommended exchanges:
🟡 Binance🟡 Bitfinex🟡 Bitmart🟡 Bittrex🟡 Bitget
🟡 CoinEx🟡 Crypto.com🟡 Gate.io🟡 Huobi🟡 Kucoin.


Comments